

 Professional Overclocking and Hardware
TecLab FramePower Tool
Find out how much your PC delivers and how much it consumes. FPS, 1% low, GPU and CPU power in watts, energy per frame and even the energy cost per hour, all in real time.
 TecLab FramePower Tool v0.9.157
— ☐ ✕
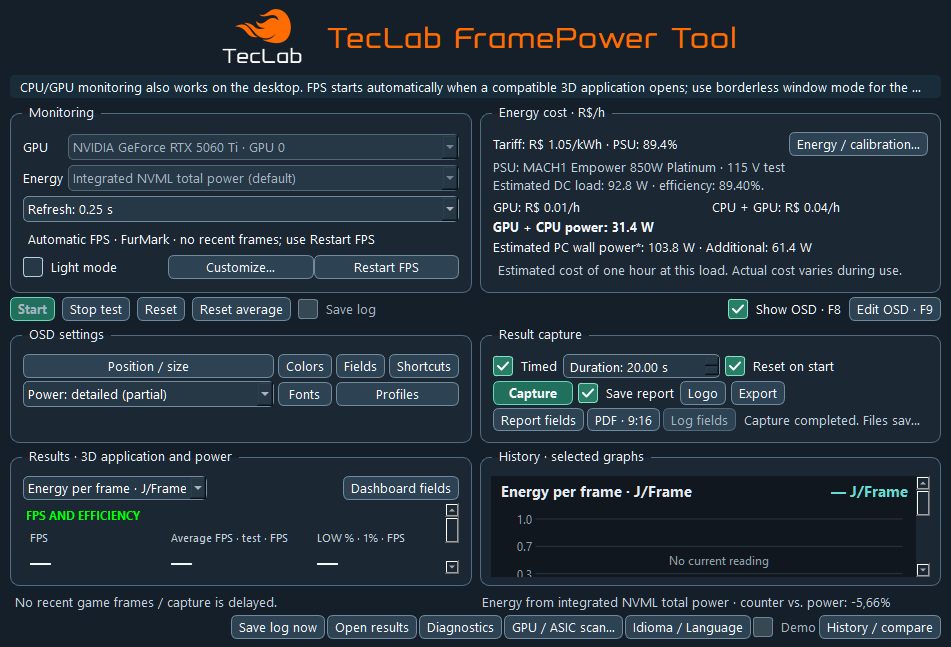
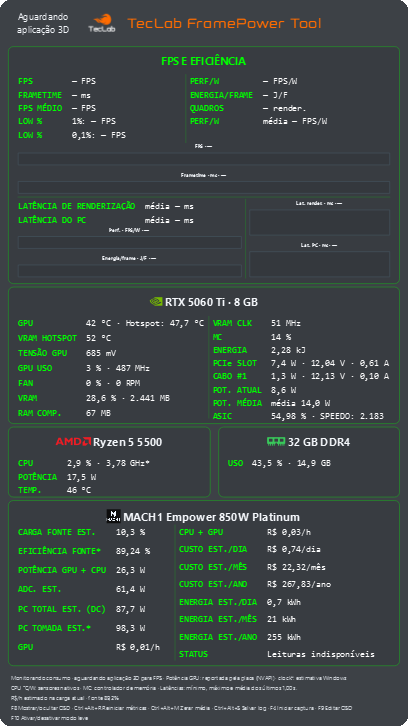
Real app screens · click to enlarge
Performance and power, side by side
Knowing your FPS is not enough. FramePower Tool shows how much energy each frame costs and how much that adds to your electricity bill.
FPS, frametime and latency
Detects the running game and measures average FPS, 1% and 0.1% lows, frame time, render latency and PC latency.
Real efficiency
FPS per watt and joules per frame. Compare graphics cards, settings and undervolts with numbers, not guesswork.
Energy cost
Estimated wall power and cost per hour, day, month and year, using your own electricity rate.
Your real PSU
Official Cybenetics efficiency curve and side-by-side PSU comparison, with the yearly savings of each one.
Full in-game OSD
GPU, CPU, RAM, PSU and costs on top of the game, with custom position, colors, fields and profiles. F8 shows it, F9 edits it.
Reports and history
Run timed captures and create PDF, PNG or JPG reports. Compare before and after every change.
Every feature, explained
Real screens from the current version. Click the images to enlarge.
Everything on screen, without leaving the game
An overlay on top of the game that shows, live, what is happening with every part of your PC.
- FPS, frametime, 1% and 0.1% lows, FPS/W and energy per frame
- GPU: temperature, hotspot, clocks, VRAM, voltage and power of the PCIe slot and of each cable
- CPU, RAM and PSU, with load, efficiency and cost in real time
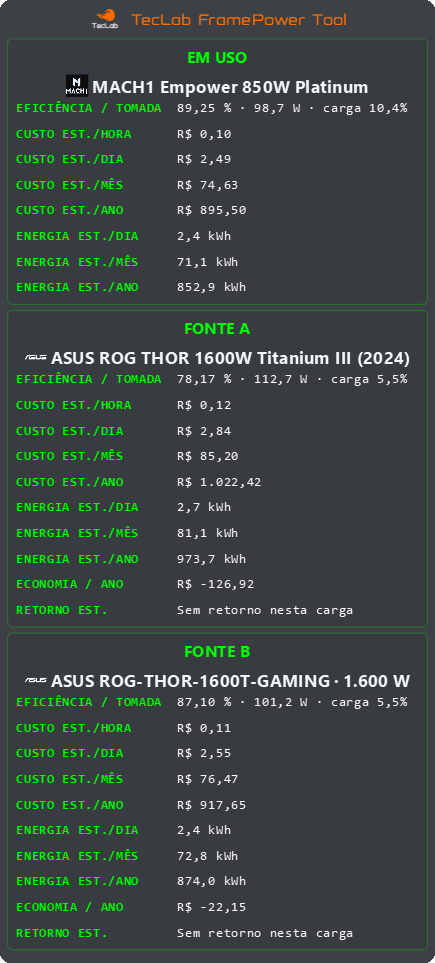
Is a new PSU worth it?
Compare your PSU with other models at your PC's real load and see the difference in your wallet.
- Efficiency and wall power of each PSU
- Estimated cost per hour, day, month and year
- Yearly savings and payback time of the upgrade
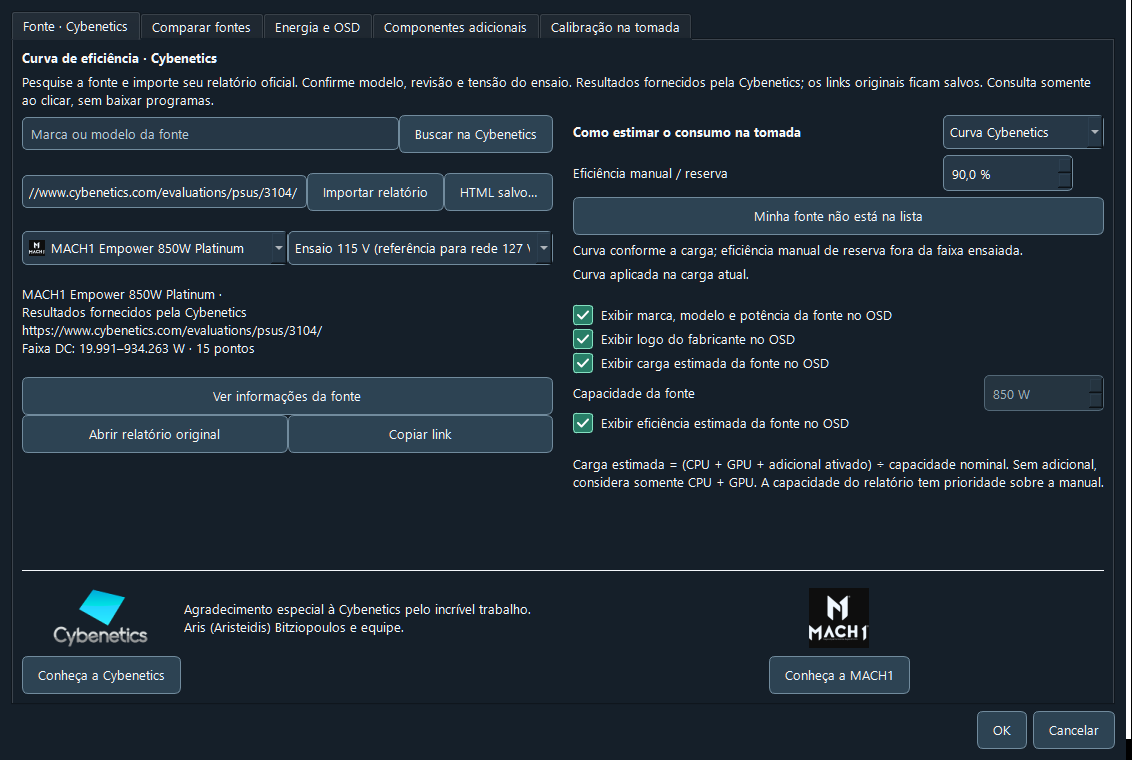
Your PSU's real efficiency
Instead of a fixed number, the app uses the curve measured in the lab by Cybenetics to estimate wall power at every load.
- Search for your PSU and import the official report, with model, revision and test voltage
- Additional components and calibration with a wall power meter
- PSU brand, model, load and efficiency right in the OSD
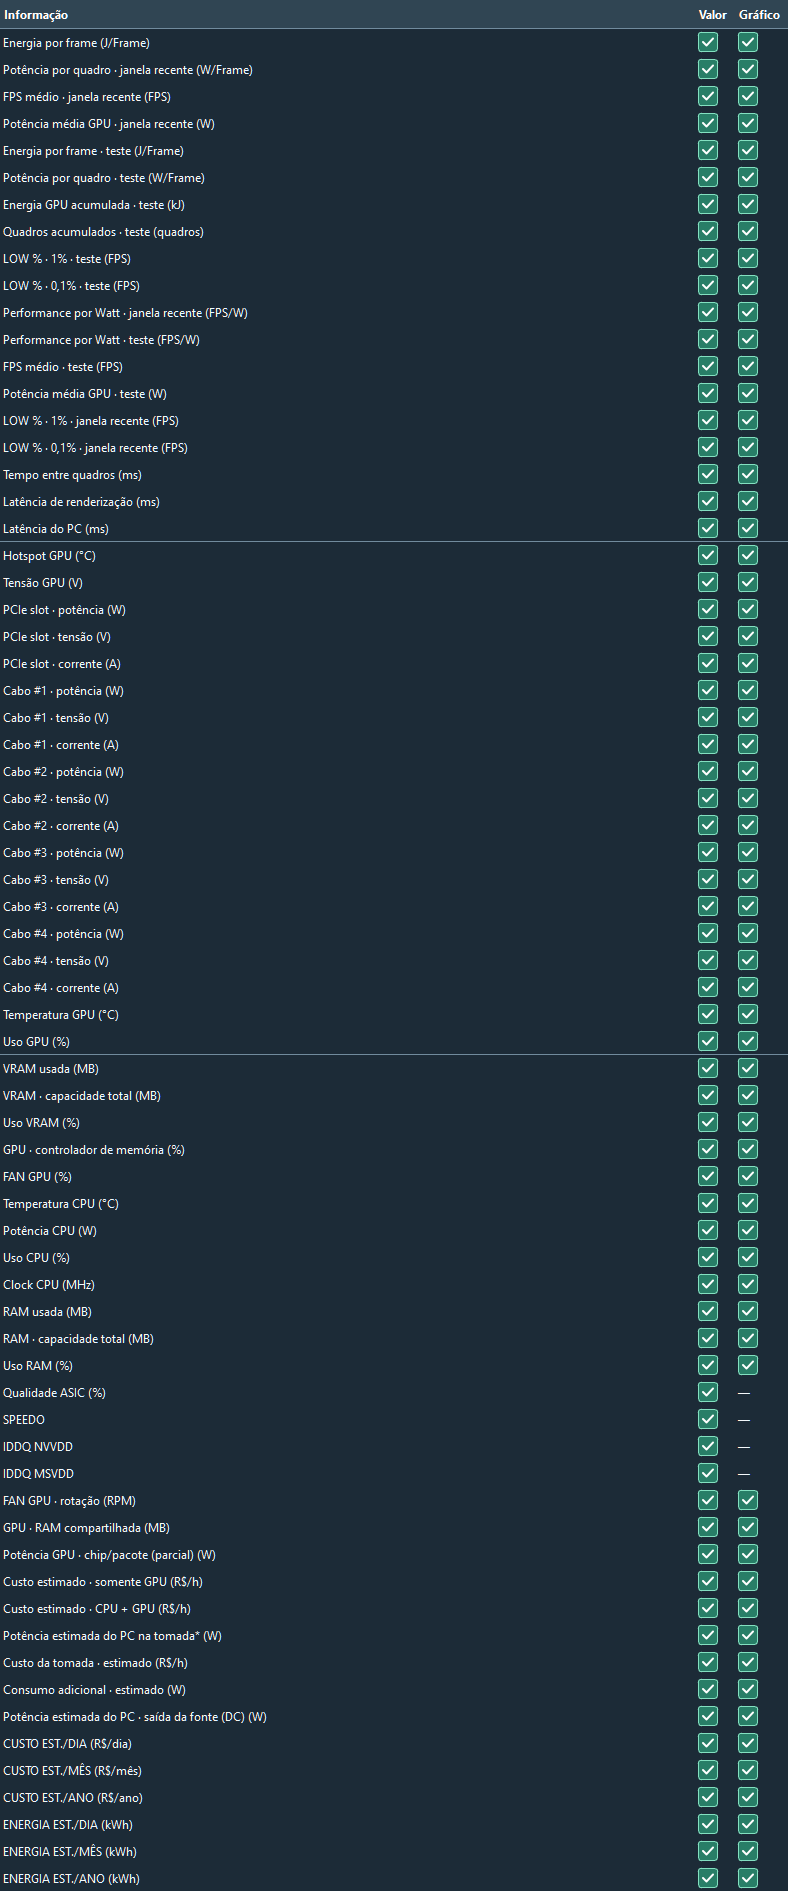
60+ readings. You choose.
Pick what you want on the main dashboard, as a value, a graph or both. The OSD, reports and logs have their own settings.
- Performance, energy, GPU, CPU, RAM, PSU and costs
- Advanced GPU data, such as ASIC quality and SPEEDO
- TecLab default button to go back to the recommended setup
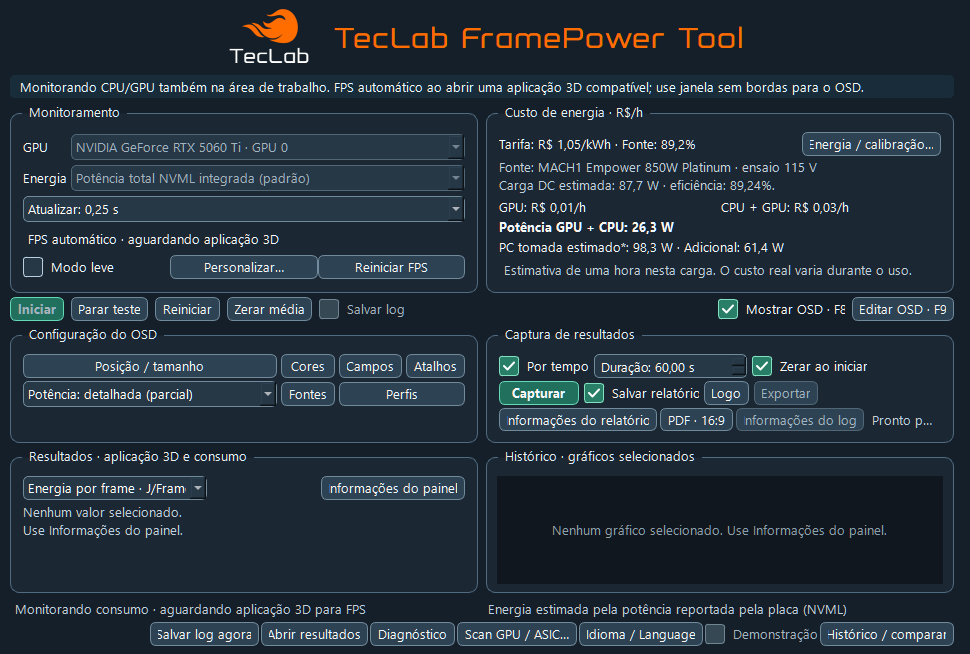
English and Portuguese
FramePower Tool has a language selector. With the Idioma / Language button, at the bottom of the app, you can switch the interface between English and Portuguese at any time.
- Same features and readings in both languages
- Switch instantly, no reinstall needed
- This website is also available in Portuguese and Spanish: use the PT / EN / ES selector at the top
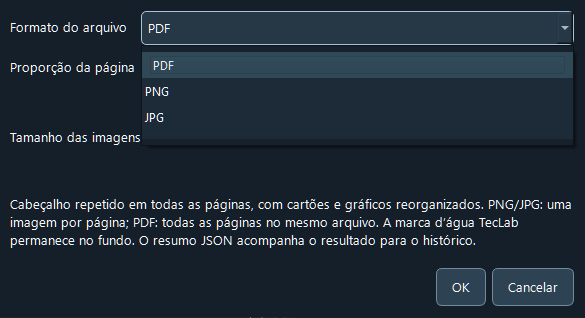
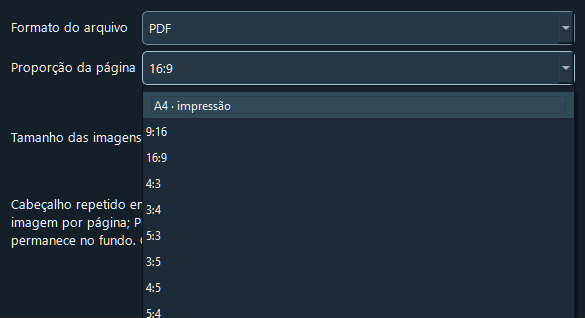
Results ready to share
At the end of a test, the app builds a report with cards and graphs, the way you need it.
- PDF with every page, or PNG and JPG with one image per page
- A4 for printing, or 16:9, 9:16, 4:5 and other formats for social media
- TecLab watermark and a JSON summary for the history
A full X-ray of your PC
Every capture creates a report with dozens of readings, in cards and graphs. This is a real example: 20 seconds in FurMark.
- GPUNVIDIA GeForce RTX 5060 Ti
- CPUAMD Ryzen 5 5500
- RAM32 GB DDR4
- PSUMACH1 Empower 850W Platinum
- AppFurMark · 20 s
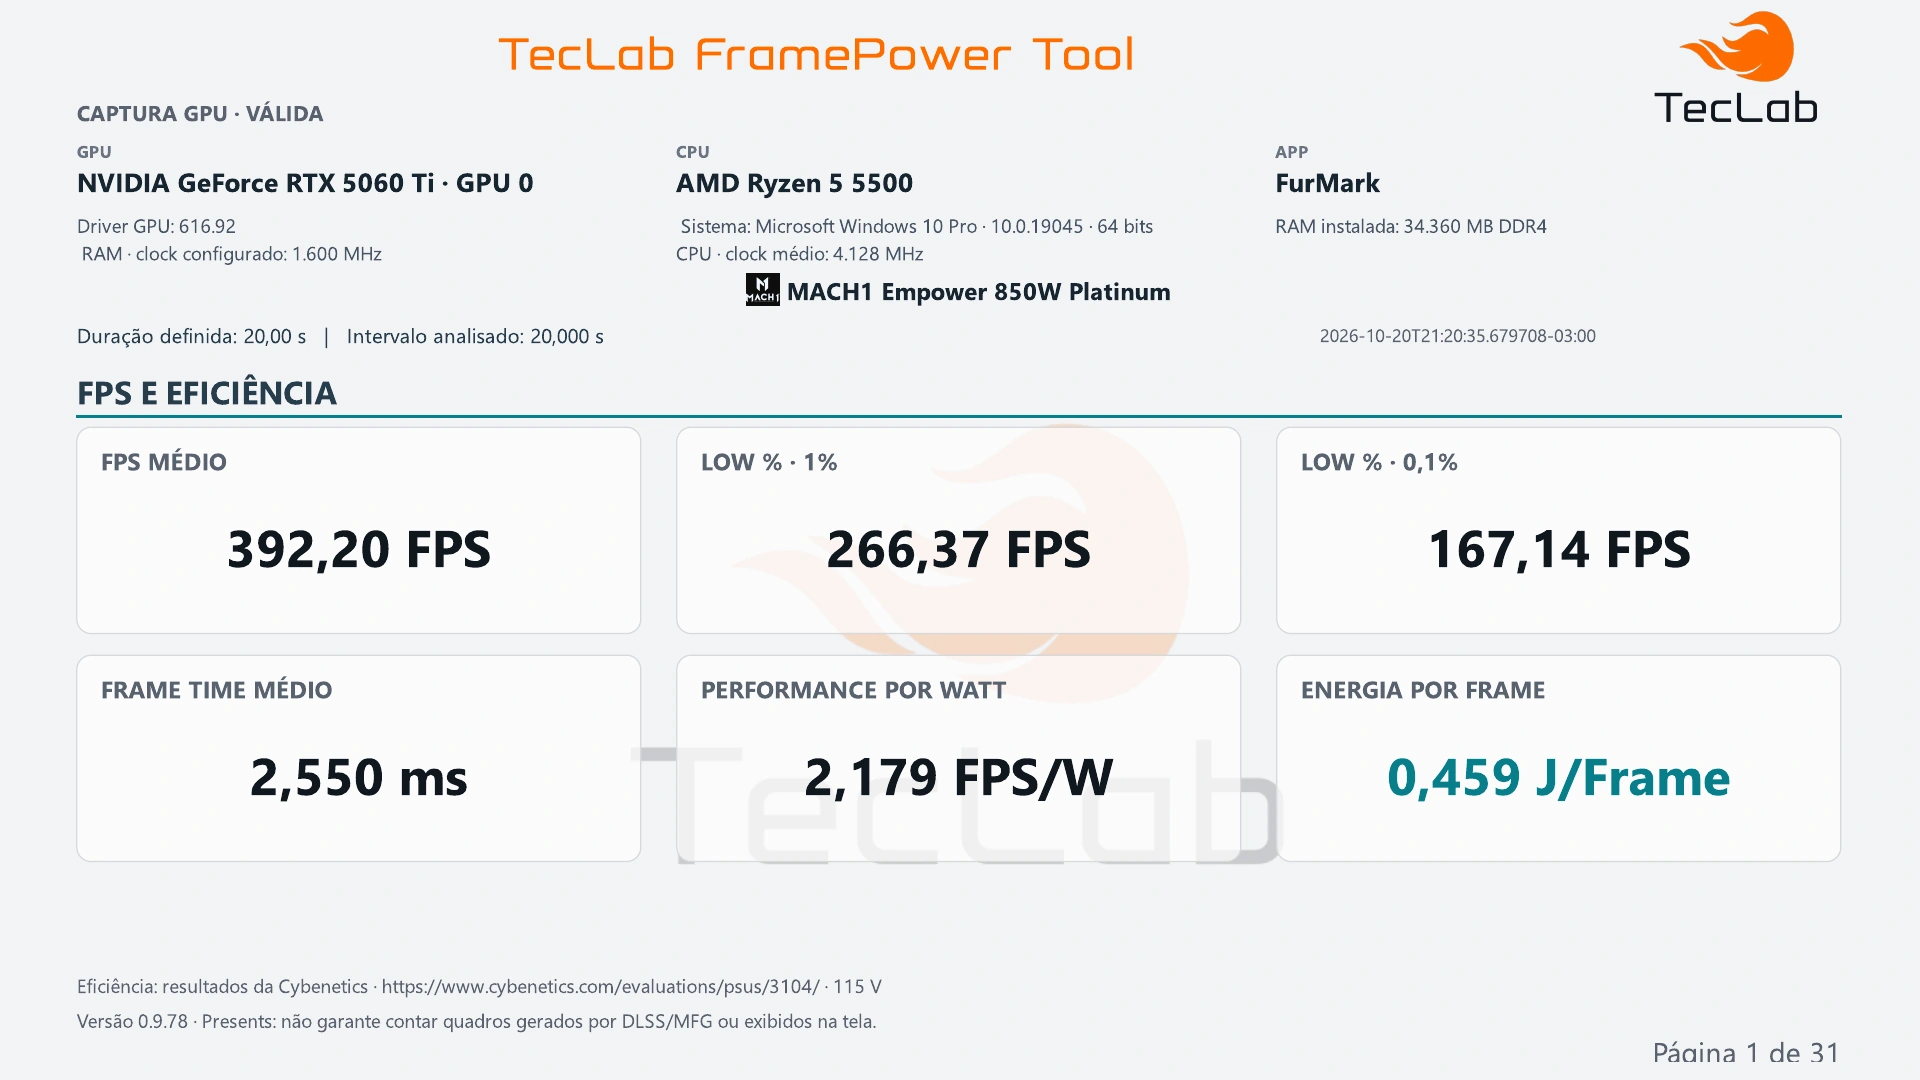
Summary: average FPS, 1% and 0.1% lows, frametime, FPS/W and energy per frame
12 of the 31 report pages · the log file you upload in the dashboard contains all of this data
App screenshots
More real app screens. Click to enlarge.
Be part of the development
The app is in beta. Your logs show how it behaves on hardware different from ours, and that is how it gets more accurate for everyone.
-
Sign up
Create your free TecLab account.
-
Use the app
Ideally with a game running, to measure FPS and power.
-
Save the log
Click Save log now. The file goes to your Desktop.
-
Upload it
Sign in and attach the file. Done, you helped!

Ready to test your PC?
Download the .zip, extract it and run the executable.
Download v0.9.157 for Windows